ATI The Alliance for Traffic Improvement
Seeking cost effective ways to reduce traffic congestion on Oahu


Myth #3 — “Rail transit will
reduce the numbers of cars on the road.”
The
decennial U.S. Census shows that there is a continuing decline in the percentage
of commuters using public transportation in virtually all U.S. cities — regardless
of whether they have rail transit or not; public transportation commuting has
declined from 12 percent in 1960 to 4.7 percent in 2000. In
|
All U.S. Census Data for journey-to-work,
1960-2000 | |||||
|
|
|
|
|
|
|
|
Percent of Workers by Mode |
1960 |
1970 |
1980 |
1990 |
2000 |
|
Private Vehicle |
64.0 |
77.7 |
84.1 |
86.5 |
87.9 |
|
Public transportation |
12.1 |
8.9 |
6.4 |
5.3 |
4.7 |
|
Walked |
9.9 |
7.4 |
5.6 |
3.9 |
2.9 |
|
Other means |
6.8 |
2.5 |
1.6 |
1.3 |
1.2 |
|
Worked at home |
7.2 |
3.5 |
2.3 |
3.0 |
3.3 |
Just
in the last ten years the 2000 Census data shows that the nation had 13 million
more drivers than in 1990, and 2 thousand fewer commuters using public
transportation. See Census details.
Secondly,
even if the nation’s metro areas were able to halt this slide and maintain the
same percentage of public transportation use, the growth in population and thus
people driving to work would still totally overwhelm public transportation.
Let’s
put this in
Here’s
some examples for individual metro areas for the past ten years: Washington DC had
35 thousand fewer commuters using public transportation in 2000 than in 1990, but
had 317,000 more drivers; Portland: 22,000 more transit users and 173,000 more
drivers.
Here’s the Census journey-to-work data for the top 49 metro areas.
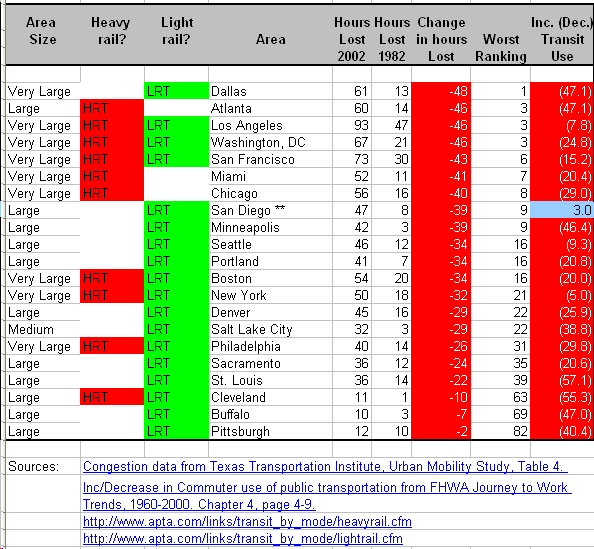
The following table shows all the metro areas with rail sorted according to greatest increases in traffic congestion ("Change in hours lost") 1982-2002, together with their ranking. The last column shows the Increase/(Decrease) in the percentage of commuters using public transportation. Thus, for example, Honolulu in 1980 had 10 percent of its commuters using public transportation and that dropped to 8.3 percent in 2000, a decline of (17.0) percent.