honolulutraffic.com
seeking cost-effective ways to reduce traffic congestion in Honolulu
Vital statistics:
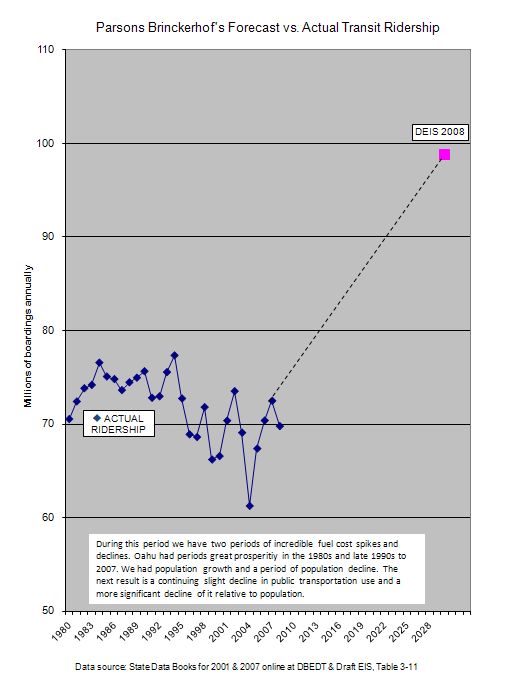
This chart shows TheBus ridership actual trend versus the latest forecast made a year ago for what is called the No-Build Alternative by Parsons Brinckerhoff in the Draft EIS. It was approved by the City and the Federal Transit Administration.
The No-Build ridership forecast is essentially a baseline forecast for what results if we keep on doing what we have been doing.
That is, expanding the bus system to keep pace with population and also making fairly minor highway improvements. Since that is what we have done for the past 20 years the forecast should match what is happening in reality.
The significance of the No-Build ridership forecast is that it is derived from the same computer models that forecast the rail ridership. Most of the model variables that drive the rail forecast also drive the No-Build forecast.
This means that if you don’t find the No-Build forecast credible you should not find the rail forecast credible either.
The actual bus ridership has been gently declining for the past 25 years. The City took over the bus system from HRT, Ltd, in 1971-2, at which time it was a privately-owned profitable tax-paying company. Once the City took over, the City rapidly increased ridership by expanding service along unprofitable routes while also incurring significant subsidies. These are now about 10 percent of our City budget.
The ridership peaked in 1984 and since then has declined about ten percent as can be seen from the chart. The decline since 1984 has occurred despite increased population, generally higher gasoline prices, and providing higher service levels to the public through a 25 percent increase in the number of buses in service.
The Draft EIS offers no rationale for this massive future increase in projected bus ridership even though this would be a change in the quite clear and unmistakable downtrend.
Our question to FTA: Can you give us a credible explanation for this Draft EIS No-Build forecast for 2030?
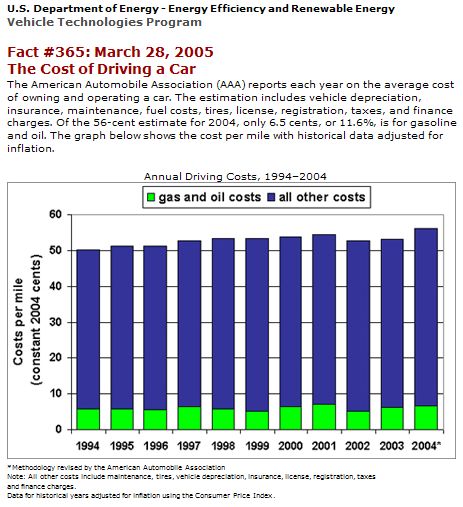
Why high gas prices do not affect driving that much:
Over the last ten years gas and oil only amounted to 10-12 percent of total driving costs. This may well account for how little high gas taxes have impacted European driving habits where they are used to $5-$7 a gallon gas.
Teleworking's prospects more important than transit:
Back in October we quoted Reason Foundation's Ted Bala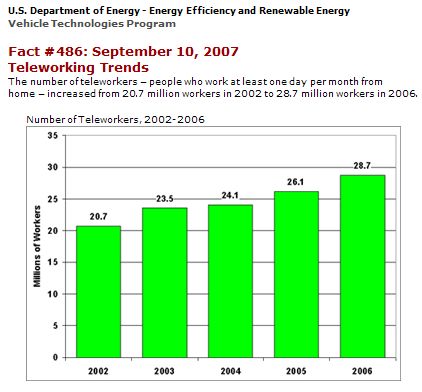 ker saying, "In some cities like San Diego, Dallas
and Phoenix, telecommuters now outnumber public transport commuters. In Oklahoma
City telecommuters outnumber transit commuters by nearly five to one."
ker saying, "In some cities like San Diego, Dallas
and Phoenix, telecommuters now outnumber public transport commuters. In Oklahoma
City telecommuters outnumber transit commuters by nearly five to one."
And we commented, "Of course, with market share for transit slowly declining while ratcheting up for telecommuting, one does not need to ask what the government is encouraging."
The chart here below is further proof of the viability of teleworking/commuting. It is increasing all the time while the percentage of commuters using transit continues to decline.
One would think that if elected officials were to ever think beyond campaign contributions and the next election, they would encourage business to expand telecommuting opportunities.
For example, they could encourage tele-commuting by City and State employees.
They could encourage our high tech industry to stage a Telecommuting Conference where large and small businesses could see the latest advances in technology that make it possible for the increases that we are seeing in telecommuting.
Comparison of various cities (MSA) cost per capita of their light rail lines.
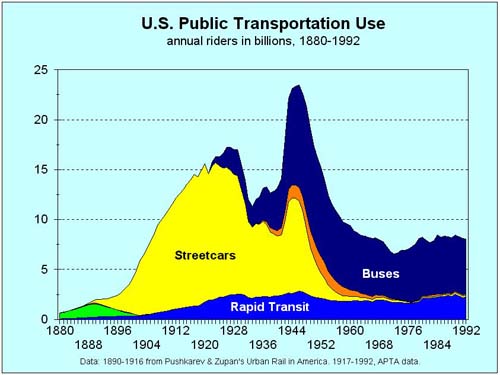
U.S. use of public transportation, 1880-1992.
U.S. Census journey-to-work data summary sheet, 1960-2000.
Journey-to-work census data for 50 largest MSAs 1980-2000.
Changes in commuter use of public transit by MSA by year rail began operation.
Details of energy use by various modes of transit.
Bus ridership stats: An important data set is annual public transportation
ridership over the past 30 years and the trends that can be derived from them.
We have taken the official City data that they give to the State of
From all this we find that bus ridership peaked in 1994 and is currently running about ten percent below that peak. Passengers per bus mile peaked in 1984 at 4.5 and the latest in 2005 is 3.1. This along with passengers per bus and passengers divided by population show us that we have had significant increases in bus service and this has prevented ridership from declining ever further than it might have done.
It is well worth a few minutes to review these data. READ MORE