honolulutraffic.com
Offering cost-effective ways to reduce traffic congestion in Honolulu
![]() December 30, 2009.
December 30, 2009.
It is difficult to report news when there isn’t any, but ...
We must all be thankful that Mayor Mufi Hannemann is not breaking ground on the first section of the rail line as he has long promised he would do before the end of this year.
The question is will he ever break ground?
The hurdles at the moment appear to be caused by the City’s failure to follow all the legal requirements of the environmental laws as enumerated below in our December 24 post.
If the City and FTA are able to overcome these hurdles and get all the necessary signatures they need then the paperwork, we are told, will take at least a month before they can produce a Draft Final EIS. That takes us to February.
Presumably they will then present it to Governor Lingle for her examination, hearings and, in the end, her signature. That takes us to, say, mid-March.
Then the Final EIS, assumedly with modifications made by Governor Lingle, issues within two weeks. That takes us to April.
Then it takes about 35 days from when the FEIS issues to when the FTA is allowed to issue a Record of Decision, which is the first time that litigation can take place against the FTA on this matter. That will be early May.
Of course, all of this assumes that everything goes smoothly. To enumerate some of these assumptions:
• That none of the environmental issues we have enumerated prove to be deal breakers.
• That the State Legislature doesn’t take the ˝ percent GE tax increase for state use.
• That Governor Lingle will find that all state environmental laws have been followed to the letter and that she agrees that the rail project is adequately financed.
• That the FTA doesn’t get cold feet over the clear violations of federal statutes.
All of these are reasonably well-educated assumptions, but they are assumptions. We shall all have to see how events play out.
![]() December 26, 2009.
December 26, 2009.
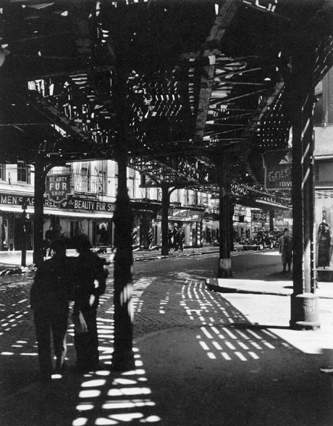
A reminder: Elevated rail is usually torn down:
 In the early 1900s the principal rapid transit in New York City were the four elevated rail lines running the full length of Manhattan. These were the Second, Third, Sixth and Ninth Avenue lines.
The Third Avenue El was the last of the New York City elevated lines to be torn down. The Museum of the City of New York has the following to say about the event that took place in 1955:
“Early in 1954 the New York City Transit Authority, NYCTA, which succeeded the Board of Transportation, concluded that the Third Avenue line was no longer needed south of 149th Street. Supposedly, the Lexington Avenue subway and East Side buses had adequate capacity to carry former Third Avenue riders in Manhattan. In the best interests of the city, the El would be closed and demolished. Operating and maintenance expenses would be saved and property values would increase.”
After its removal silence came in the late hours, property values did go up and light came to Third Avenue. It was not replaced by a subway, but by buses.
![]() December 25, 2009.
December 25, 2009.
A short history of "sprawl," or was it "dispersal"?
One of the great myths about the growth of suburbs is that they were caused by the automobile.
What really caused the growth of suburbs was a desire of the average family for a quiet, spacious affordable home with a garden for their children to play in. It was that simple in the 1800s and it is that simple today.
In the 1860s and earlier the horse drawn street railways provided upper middle class families an opportunity to leave the central city and go as far as four miles into new suburbs. In 1890 the introduction of the new electric streetcar allowed commuters to travel nearly twice as far as they had previously.
It was a time of growing affluence for the upper middle classes and they moved in ever growing numbers to the suburbs.
Urban planners a hundred years ago believed their biggest problem was how to effect “dispersal.” They needed to find ways to move families out of the tiny, fetid tenements to the suburbs. As late as 1925 Lewis Mumford was saying,
"...instead of setting our minds and hands to make the big city more titanic than ever, we should attempt rather to stimulate and direct the forces that make toward a wider diffusion of population and well-being."
When the automobile became available to the middle classes around 1915, it allowed commuters to access ever further suburbs.
So when we use the pejorative, “sprawl,” we might remember that the automobile only continued the process that had begun in the mid-1800s, and that it was people that caused the “dispersal,” not the automobile.
![]() December 24, 2009.
December 24, 2009.
The FTA and the City have their problems ...
The FTA and the City really do have serious legal problems with their environmental evaluation of the rail project.
First, the City did not, “Rigorously explore and objectively evaluate all reasonable alternatives” during the alternatives analysis process as required by law. The at-grade light rail and the Managed Lanes alternative (Bus/Rapid Transit on tollway) are two obvious ones that should have been “rigorously” explored.
At the same time they are supposed to be exploring alternatives, they are also required to work with “consulting parties” such as the Historic Hawaii Foundation and the O’ahu Island Burial Council about routes and technologies that might avoid Honolulu’s historic properties and burial grounds. They did not do that.
In fact, the FTA allowed the City to dismiss the Managed Lanes Alternative from the EIS before it had been fully evaluated. The FTA even restarted the environmental process by issuing a second notice in the Federal Register to restart the process, the only difference being that the Managed Lane Alternative was omitted.
The correct and legal early evaluation of alternatives is imperative not only for transportation purposes but also to evaluate how to avoid or mitigate the impacts of rail on historic properties including Hawaiian burial grounds.
In the EIS they totally downplayed the drastic environmental impact of the rail line in Honolulu’s historic districts. The trains run on a 30-foot wide, 35-foot high concrete rail bed, supported by 6 to 8-foot diameter pillars carrying trains every 1˝ minutes at 79 decibels. These impacts are impossible to mitigate; they could have chosen an alternative route/technology that would avoid the historic properties altogether and complied with the law.
In the EIS they are supposed to rigorously study the full extent of the line from Kapolei to UH Manoa and Waikiki. In fact, they only studied the starter version from East Kapolei to Ala Moana Center. This omission poses major legal problems for them.
The EIS renderings deliberately misrepresented the visual impact of the rail line. The widths of the guideways shown are undersized, the supporting columns are also shown undersized, and none of the tall sound-mitigation panels are shown. Even the shadows cast by the project are deemphasized. In short, the intrusiveness of the project on our city is not realisticly portrayed.
They misrepresent residents’ views in the EIS by selectively choosing those official polls purportedly showing that residents prefer rail to roads while omitting those polls showing that residents prefer roads to rail.
The EIS discussions of traffic congestion have carefully avoided any comparison of future traffic with rail versus today’s traffic. To do so they would have to admit that their forecast shows that traffic in the future will be far worse than it is today, even with rail.
Another problem the FTA faces is that while its goal is to “aggressively support proactive public involvement at all stages of planning and project development,” it has not done so. The FTA has allowed the City to spin, mislead, obfuscate and lie on the most important rail transit issues about which the voters should be well informed. FTA cannot say that it did not know about these misrepresentations because we have on many occasions complained about them and we have given the FTA the full details.
Maybe the City and the FTA will somehow be able to take the completely legally deficient Draft EIS and produce a legal Final EIS. We doubt it.
For a printable single page pdf of this post, click here
![]() December 21, 2009.
December 21, 2009.
Vancouver's new rail line can be compared to ours:
Vancouver new line can rightly be compared to ours if you consider the lies, spin, misstatements, exaggerations and an unwillingness to follow the right environmental procedures.
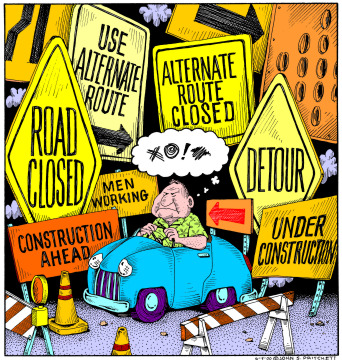 The critics of the new Vancouver line have their own website and it is a rich one that is worth browsing on. For example, the chaos of the years of construction was editorialized in the Vancouver Sun and is quoted as follows:
"Construction activity has reached the point of the ridiculous. Not ridiculous as in silly but ridiculous as in over the top, untenable, exasperating.
"It's not just that various levels of government have sites under construction in preparation for the 2010 Olympics -- most notably, a SkyTrain extension which, since December of 2005, has turned the pivotal roadway that is Cambie into a knuckle-crunching no-go zone.
"It's also because condominium towers are popping up in the midtown and downtown areas like weeds in a compost heap.
"Business couldn't be better for those no-nonsense women in lumber jackets assigned by construction companies to hold signs, instructing "stop" or "slow." But life has become nerve-racking for the rest of us. Delays. Detours. Buses diverted from regular routes. Construction noise. Dust. Honking.
"What else is there for drivers to do but take it out on one another?"
Try this website.
![]() December 17, 2009.
December 17, 2009.
PBN reports Hawaii has 4th worst roads in nation:
Today's Pacific Business News reported on the Reason Foundation's 18th Annual Highway Report. They say that:
"Hawaii has among the worst state highways in the country, according to a report released Thursday.
"Hawaii ranked 46th out of the 50 states, ahead of only New Jersey, California, Rhode Island and last-place Alaska.
"North Dakota has the nation’s most cost-effective, state-owned highway system, according to Reason Foundation’s 18th Annual Highway Report.
"The Reason Foundation study examined state highway systems in 11 categories, including congestion, pavement condition, fatalities, deficient bridges and total spending.
"Hawaii ranked among the worst states for deficient or obsolete bridges, urban interstates in poor condition, the percentage of rural, narrow lanes, and disbursement costs for administration, maintenance and capital improvements.
"For example, Hawaii placed 44th for capital and bridges disbursements, spending $186,000 per state-controlled mile.
"Top-ranked South Carolina, by contrast, spent only $14,000 in the same category.
"The report, which is based on information that each state reported for the year 2007, found that more than half of all state-owned highways across the country are congested and 25 percent of bridges are deficient or functionally obsolete.
“This year’s report shows the difficulties that many states are having when it comes to making across-the-board progress in road conditions,” said David Hartgen, lead author of the highway report and a senior fellow at the foundation. “In many cases, we see two steps forward, one step back. We saw improvement in five key categories in 2007, but also found that over a quarter of the nation’s bridges are rated deficient. Urban interstate conditions are worsening again. And real progress in reducing urban congestion has slowed to a crawl.”
View the detail in the Reason Foundation’s 18th Annual Highway Report.
British rail staff required to travel on buses; it's cheaper:
The national British newspaper, the Daily Mail carried a story recently detailing the high costs of rail travel versus buses causing British Rail executives to order their staff to use long distance buses. The world of government run transit always has its amusing side.
![]() December 11, 2009.
December 11, 2009.
Historic Hawaii Foundation update on rail:
We reprint the following from the Historic Hawaii Foundation website. While this is dated November 17 we do not believe there has been any significant change since then:
Historic Hawai‘i Foundation continues to participate in the Section 106 consultation process for the Honolulu High Capacity Transit Corridor. The process is working towards a Programmatic Agreement (PA) that will become a legally binding commitment for avoiding, minimizing and mitigating adverse effects to historic properties within the 20-mile rail corridor. Adherence to the PA, once it is finalized and executed, becomes a condition of federal funding and approvals for the project.
HHF provided written comments on the draft PA dated November 2, 2009. After reviewing the City’s response to HHF comments, provided on November 13, HHF found the City’s response to be inadequate, leaving the issues unresolved. HHF has asked for further review and clarification from the Federal Transit Administration (FTA) on the outstanding issues. In her communication to FTA, Executive Director Kiersten Faulkner stated that HHF recognizes that compliance with section 106 is the responsibility of the federal agency. “I hope and expect that these issues will be resolved prior to the PA being finalized,” Faulkner wrote.
The final PA is executed by the FTA, the State Historic Preservation Division and the Advisory Council on Historic Preservation. Invited signatories will include the City’s Department of Transportation Services and the National Park Service. All consulting parties are also invited to concur in the agreement.
“The Programmatic Agreement is still a work in progress,” said Faulkner. “We will continue to review and comment on each iteration until HHF’s concerns are addressed. At that point, we will determine whether or not to be a concurring party to the agreement.”
Faulkner explained that being a concurring party to the PA is not an endorsement of either the process or the rail project as a whole, but would indicate whether or not HHF agreed impacts to historic resources were adequately evaluated and mitigated. HHF intends to continue to have a role in the ongoing protection, preservation, avoidance, minimization and mitigation for historic sites affected by the project, and to ensure that the stipulations of the agreement will be implemented in a way that appropriately identifies, protects and mitigates harm to historic resources.
“HHF has been clear throughout the consultation process about our expectations for what the PA needs to address,” Faulkner said. “If those expectations are met, we will concur with the agreement; if not, we won’t. In either case, we will continue to work to ensure that the project incorporates a sensitivity to preservation issues and limits impacts on historic sites and properties.”
Bob Poole discusses : "Capacity and Congestion Relief":
In this month's Surface Transportation Innovations, Bob Poole briefly deals with the issue of how much capacity is needed to provide congestion relief. The New York Times described Bob as, "For 17 years, Mr. Poole has been the chief theorist for private solutions to gridlock. His ideas are now embraced by officials from Sacramento to Washington." He is worth paying attention to.
The main point he makes is that the evidence is quite clear that building roads does help reduce traffic congestion and for the biggest impact for the dollar, build priced lanes such as HOT lanes.
"The question of how much sheer physical capacity it would take to keep urban traffic congestion in U.S. metro areas from getting worse has been regularly asked in the Texas Transportation Institute’s Urban Mobility Reports. The 2009 report is no exception. On pages B-27 and B-28, the report summarizes a calculation exercise in which TTI researchers Tim Lomax and David Schrank looked into how much each metro area added to its roadway capacity, compared with how much it would need to add to keep the average “loading” of the roads from getting worse. Their Exhibit B-18 compares average annual lane-miles needed with average annual lane-miles actually added, for urban areas in the four size categories used in the report: very large, large, medium and small. The “small” areas added about 50% of the lane-miles needed, while the other groups averaged only 43%, so obviously, congestion kept increasing.
However, some individual metro areas did better and some did worse than these averages. Exhibit 12 in the main 2009 report compares the congestion levels from 1982 through 2007 in 90 metro areas, divided into three groups. Ten percent of those metro areas (i.e., only nine) kept their road capacity growth to within 15% of the growth in vehicle miles of travel (VMT), and their congestion growth has actually been in a gradual down-trend since 1999. The 44 urban areas that allowed VMT growth to exceed capacity growth by between 15% and 35% had much higher congestion by 2006, and saw a small drop only in 2007, most likely due to $4 gasoline. And the 37 urban areas that added even less road capacity (where demand grew more than 35% faster than capacity) had even higher congestion by 2006 (again, with a small drop in 2007).
To be sure, all of these calculations are based on adding un-priced lanes. The addition of priced lanes, instead, would be a “two-fer,” in that the new lanes could provide guaranteed uncongested traffic flow in addition to the gross capacity increase. Plus, they would be at least partially self-funding. I guess that would make such additions a “three-fer."”
![]() December 10, 2009.
December 10, 2009.
Here's a question for the FTA:

This chart shows TheBus ridership actual trend versus the latest forecast made a year ago for what is called the No-Build Alternative by Parsons Brinckerhoff in the Draft EIS. It was approved by the City and the Federal Transit Administration.
The No-Build ridership forecast is essentially a baseline forecast for what results if we keep on doing what we have been doing.
That is, expanding the bus system to keep pace with population and also making fairly minor highway improvements. Since that is what we have done for the past 20 years the forecast should match what is happening in reality.
The significance of the No-Build ridership forecast is that it is derived from the same computer models that forecast the rail ridership. Most of the model variables that drive the rail forecast also drive the No-Build forecast.
This means that if you don’t find the No-Build forecast credible you should not find the rail forecast credible either.
The actual bus ridership has been gently declining for the past 25 years. The City took over the bus system from HRT, Ltd, in 1971-2, at which time it was a privately-owned profitable tax-paying company. Once the City took over, the City rapidly increased ridership by expanding service along unprofitable routes while also incurring significant subsidies. These are now about 10 percent of our City budget.
The ridership peaked in 1984 and since then has declined about ten percent as can be seen from the chart. The decline since 1984 has occurred despite increased population, generally higher gasoline prices, and providing higher service levels to the public through a 25 percent increase in the number of buses in service.
The Draft EIS offers no rationale for this massive future increase in projected bus ridership even though this would be a change in the quite clear and unmistakable downtrend.
Our question to FTA: Can you give us a credible explanation for this Draft EIS No-Build forecast for 2030?
![]() December 7, 2009.
December 7, 2009.
Smart Business Hawaii reveals rail as a polluter:
Yesterday at a press conference Smart Business Hawaii held at City Hall, Senator Sam Slom, aided by Dr. Prevedouros, revealed the results of a study by Demographia, a research organization headed by Wendell Cox. The Hawaii Reporter, Star-Bulletin and the Advertiser and all three TV news stations reported on it.
The study, funded by Smart Business Hawaii, shows that most probably the rail transit line is far more likely to be a net polluter than there is of any net pollution savings. The City Managing Director Kirk Caldwell disputed the findings by, as usual, attacking the intentions and morals of the study's authors and presenters.
However, emissions from various urban transportation modes closely follow their energy efficiencies. The U.S. Department of Energy provides that data in their annual report and we find that the energy use per passenger mile for autos is 3,514 Btus while for light rail the averages are all over the place but Figure 2.2 shows that very few light rail systems are as efficient as autos. Thus, it should not be surprising that emissions are lower as well.
![]() December 7, 2009.
December 7, 2009.
Let's straighten the record on the rail budget:
The City is boasting that the recent contract they signed came in $90 million below City estimates, which just proves how conservative they are. Wrong. Their estimate is for the final cost of the project with all the change orders taken into account — and there will be many.
Last week when asked to explain the newspaper account detailing how the City is using $300 million in bus funds to build rail, City Transportation head, Wayne Yoshioka, said that the plan was actually a worst case scenario that would only be used if everything went wrong. We disagree; the financial plan submitted to the Federal Transit Administration was to justify entry into the next phase called Preliminary Engineering. Quite plainly, as is printed on its cover, it is THE PLAN; it is not the worst case scenario. The worst case scenario is a huge hike in property taxes which will be needed anyway for construction cost overruns and the forecast operating losses.
You can listen to Yoshioka being questioned and the answers he gives in this short recording from a Neighborhood Board meeting held last week.
![]() December 4, 2009.
December 4, 2009.
Governor Lingle's weekly radio address is on rail transit:
Here is her address:
"Aloha. As the City and County of Honolulu continues to move forward on its rail project, my obligation as Governor is to review the Environmental Impact Statement, or EIS, for completeness.
Both state and federal government entities must accept the final environmental report before the City can begin construction on the largest construction project in state history.
I have the obligation to conduct a thorough objective review of the EIS. Among the things I will review are whether all construction and design alternatives were sufficiently reviewed and whether or not the financial plan is feasible.
This is especially important in our current economic situation. I take this obligation very seriously and I will not simply "rubber stamp" the document.
When I do receive the final EIS, I will take an appropriate amount of time to review it to ensure all the people of Hawai`i will be well-served by this project now and in the future."
Click here to listen to the address.
![]() December 3, 2009.
December 3, 2009.
"Friends of Makakilo" tell of Leeward problems:
In a letter just sent to Governor Lingle a citizens' organization headed by Dr. Kioni Dudley lays out the problems with rail from their perspective under the following headings:
- Ho’opili station in the middle of an open farm field.
- Rail is not an appropriate use of land in an agricultural district.
- No park-and-ride for thousands of commuters on Ft. Weaver Rd. Rail, as designed in this FEIS, is not being built to solve current traffic problems.
- Have the people of Waipahu been consulted about the loss of their newly beautified main thoroughfare?
- UHWO park-and-ride needs parking structure to save priceless farmland.
- Train could be at-grade from DeBartelo Center to Stadium if ORL right of way was used.
- Loss of view-planes in downtown Honolulu
This is a great letter and well worth reading in its entirety.