honolulutraffic.com
formerly The Alliance for Traffic Improvement
Seeking cost effective ways to reduce traffic congestion on Oahu


![]() October 31, 2006.
October 31, 2006.
Mayor: "We will take the frugal $3.6 billion route":
 The Mayor gives a
whole new meaning to the word 'frugal.' And
judging from the reactions we have heard in
the past 24 hours, the public is not buying
it.
The Mayor gives a
whole new meaning to the word 'frugal.' And
judging from the reactions we have heard in
the past 24 hours, the public is not buying
it.
That is because the public knows that elected officials will not be satisfied until they build the entire $4.7 billion rail line.
In addition, the public knows that there are going to be significant cost overruns of somewhere between 25 and 50 percent � now we are up to $6 to $8 billion.
That is before we get to the interest since the City does not have much cash and will have to borrow all but the $500 million in federal money. This will come from the sale of bonds. If we just pay the 5.5 percent interest on the bonds, that will be $385 million annually.
Only paying the interest would not be too wise since at 25 years out the bills for extensive multi billion rebuild and refurbishing will start coming due. Best we pay off the capital by 25 years out. Let's see, $7 billion paid off with interest at 5.5 percent will take $520 million annually. To that we have to add $75 million annually in additional operating losses over and above the $100+ million for TheBus. Altogether that is about $600 million annually or four times what the � percent tax hike will bring in.
Dear God, somebody has to start getting real about this.
Just a reminder, sign up as a supporter of ours:
If you are in agreement with us, sign up by
simply clicking the Join us tab to the
left. Here are the latest members to sign
up:
|
Melvin Ah Ching |
Cliff Coleman |
Paul Smith |
|
Dan Dudden |
Walt Harvey |
Arla Harvey |
|
Reg White |
Connie White |
Jack Pedesky |
|
Gerri Pedesky |
Ray Pendleton |
Michael Simpson |
|
Marian Grey |
Jim Grey |
Laura Brown |
|
Garry P. Smith |
Don Meyers |
Colby Jones |
|
Helen Carrol |
Jeri Kessler |
Robert Kessler |
|
Kona Smith |
Sumner Howard |
Pam Smith |
|
Carol Thomas |
Jack Davis |
Cole Slater |
One of our problems is the Gridlock Gang:
The Gridlock Gang are all those people who tell us, �The more roads you build, the more you encourage people to drive. There needs to be other programs and incentives for people to get out of their cars.� They forget about H-3 and the congestion relief it brought, and still does for the folks on the Windward side.
![]() October 27, 2006.
October 27, 2006.
Please review upcoming event on the "events" tab to the left.
It is important that you do this in order to get support for our various speakers and show the Council and other elected officials that we have supporters willing to take the time to attend.
A glimpse into Portland's rail transit security problems:
Excerpts from Portland Oregonian reporting: "�the number of people banned from trains and buses on any given day has dropped from about 1,000 to a few hundred, according to the transit agency� Some [transit police] officers are so concerned they won't let their families ride light rail alone �. A frightened woman called 9-1-1 after a man followed her from train to train, leering and trying to engage her in conversation � But today they probably wouldn't have excluded the man because his behavior -- while disconcerting -- didn't appear to cross the line into criminal conduct �. deputy district attorney for Multnomah County assigned to prosecute transit crimes , advised TriMet in a strongly worded memo that, in his view, it was making its system less safe. �Prostitutes could loiter in your shelters and on your platforms but could not be excluded. Drug dealers and drug addicts could loiter on your system and nothing can be done to exclude them. Gang members could occupy these areas with no intent of using your system, but simply to hang out and wait for the next adventure or worse, the next victim." READ MORE
HHUA gave us a week that was highly informative:
The Hawaii Highway Users Alliance brought the following people into town this week and they, together with Dr. Prevedouros, gave some 13 different presentations over a three day period:
- Robert Poole, founder, Reason Foundation and father of the HOT lanes movement;
- Dr. Martin Stone, AICP, Director of Planning, Tampa Expressway Authority;
- Randal O'Toole, founder of the American Dream Coalition and scholar with both the Cato Institute and Reason Foundation
For those of you who attended one or more of the PowerPoint presentations and wish to refresh their understanding of them, they are available below for downloading:
- Keynote Speech: Poole's Addressing Honolulu's Mobility Crisis
- Stone's Solutions for Urban Traffic Congestion,
- O'Toole's Overview of Portland's problems
- Prevedouros' Traffic Operations � Solutions to Traffic Congestion
- Poole's HOT Lanes: Congestion Relief and Better Transit,
![]() October 26, 2006.
October 26, 2006.
Orski: Trans commission gets down to business:
" After two meetings filled with tutorials on various aspects of the federal surface transportation program, the [new] National Surface Transportation Policy and Revenue Commission finally got down to the business of examining substantive policy issues. At its October 18-19 meeting, with newly confirmed Transportation Secretary Mary Peters in the chair, the Commission focused on three related topics: tolling, congestion pricing and the role of the private sector in transportation infrastructure. All three issues are of considerable relevance to the transportation community and are likely to influence the development of any future national transportation policy. They also are still capable of raising questions in the minds of the Commissioners, as became evident during the meeting." READ MORE
Great explanation of what really happens with TODs:
The author concludes, " Rail advocates purport that we must have expensive and heavily subsidized rail transit to attract transit riders. Then they say we need subsidized TODs to get more people to live along rail lines to get a few people out of cars. What we end up with is more congestion, higher taxes and declining urban services."
Kathleen Calongne, a research assistant for the Center for the American Dream at the Independence
Institute in Golden, Colo., wrote this commentary for the Georgia Public Policy Foundation. READ MORE
![]() October 19, 2006.
October 19, 2006.
Our rail transit projected cost is third highest in nation:
Allowing for inflation, for post-1940 rail lines, only San Francisco's BART and Washington DC's METRO forecast costs higher than those forecast for Honolulu's rail line. The City, at one point, said rail's cost would be $4 billion then changed it to the cost of the No-Build Alternative plus $3 billion. In either case, BART and METRO are still the only ones that ever forecast greater costs.
The next most expensive rail line was Atlanta's MARTA, which, in today's dollars, was forecast to cost $2.9 billion. It actually cost $4.7 billion. After Atlanta there is nothing else close among all the other modern rail lines in the U.S.
Of course, we do not know what Honolulu's line will finally cost and so we cannot compare with other cities' final costs, only their forecast ones.
Note: Our current forecast for rail is more realistic. Very simply, we took total rail costs for the 1992 proposal, deducted the No-Build cost, allowed for inflation on the balance using the Construction Cost Index, then divided it by the 1992 mileage to get today's cost per mile. We then used this cost per mile for the extension to Kapolei. The total comes to $4.14 billion � before cost overruns. For more detail on this cost READ MORE
(Sources: For cost projections of pre-1990 lines see the US DOT's Urban Rail Projects: Forecast versus Actual Ridership and Costs. 1990. For post-1990 see Dantata et. al. Trends in U.S. rail transit project cost overruns. Transportation Research Board. 2006.)
Texas DOT issues HORIZON, a new transportation magazine:
The blurb says: "The theme for this issue is �The Future of Transportation Finance,� and five experts in this area have contributed pieces. In �A Quiet Crisis in Transportation Finance: Options for Texas,� Dr. Martin Wachs of the RAND Corporation discusses the choices state and local governments should consider when determining how to finance transportation projects. Next, Robert Poole and Peter Samuel of the Reason Foundation outline the history and significance of tolling in �The Return of Private Toll Roads.� Dr. Joseph Giglio of the Hudson Institute, a keynote speaker at our annual Texas Transportation Forum, has provided �Mobility: All Roads Lead to Texas,� which highlights the need for innovative funding strategies for mobility projects. Finally, Kenneth Orski, editor of Innovation Briefs, offers �Thinking about the Future of the Highway Program,� a commentary that challenges all of us to engage in this important conversation." READ MORE
How Seattle's monorail ballooned to $11 billion:
The project started off at a little over $1 billion and finished up with a total tab of $11 billion � and that was before any cost overruns. It is instructive to read the Seattle Times on this. READ MORE
First Wachs Distinguished Lecture in Transportation:
Two days ago, UC-Berkeley honored Professor
Bent Flyvbjerg, Professor of Planning at
Aalborg University, Denmark, with the
First Wachs Distinguished Lecture in
Transportation. The title of his lecture was,
Survival of the Unfittest: Why the worst
megaprojects get built and how better policy
and planning can stop it. A recent
publication of his in the American Planning
Association Journal was,
Underestimating Costs
in Public Works Projects: Error or
Lie?The
abstract read,
"Based on a sample of 258
transportation infrastructure projects worth
US$90 billion and representing different
project types, geographical regions, and
historical periods, it is found with
overwhelming statistical significance that the
cost estimates used to decide whether such
projects should be built are highly and
systematically misleading. Underestimation
cannot be explained by error and is best
explained by strategic misrepresentation, that
is, lying. The policy implications are clear:
legislators, administrators, investors, media
representatives, and members of the public who
value honest numbers should not trust cost
estimates and cost-benefit analyses produced
by project promoters and their
analysts."
"
READ
MORE
Myths continue about 'induced demand':
That if you build more highways then the induced traffic immediately fills it up so it makes no difference. This despite the Texas Transportation Institute showing that if highway construction keeps pace with traffic growth, any congestion stays at the same level. On the local level, j ust ask folks from the Windward side about the difference that H-3 made to their commute. It has now been open for nine years and the commute times are still far better than they used to be ten years ago.
![]() October 16, 2006.
October 16, 2006.
Discover Magazine: "Is Urban Sprawl an Urban Myth?"
High-altitude photos combined with satellite images show that modern American cities are just bigger versions of older American cities.
As cities spread into surrounding territories, roadways clog, pollution increases, social inequities expand, and the costs of municipal services like sewers and the police rise. Or do they? University of Toronto economist Matthew Turner and his colleagues decided to quantify one component of change: urban sprawl. They compared satellite images of the entire continental United States in 1976 and 1992, the most recent year complete data were available, and divided the country into 8.7 billion 98-foot squares to examine the question in unprecedented detail.
Predictably, the photo evidence revealed that America has grown: Nearly 2 percent of the country was paved by 1992, for example, a third more than in 1976. Not so predictably, the percentage of growth that is sprawl is not increasing. "Although there is more development, on average, that development isn't any more scattered," Turner says. In other words, modern American cities are really just bigger versions of older American cities. READ MORE w/PHOTOS
![]() October 14, 2006.
October 14, 2006.
Just a reminder:
We can sometimes forget some of the byproducts of building a rail line. First, there is the obvious chaos of construction. Think of Dillingham being torn up from one end to the other, Ward Avenue from Halekauwila to Kona Street, and Kapiolani to University Avenue, none of which have median strips.
HOT lanes, on the other hand, will stop on Nimitz and not cross town. It will be mostly built in the median strips of Nimitz and Kamehameha Highways. If built like the Tampa Expressway, it will use a new technology never before used for highway construction. The pedestals were built at night and much of the above ground work was done without bothering motorists on the highway below.
In addition, one of the results of building rail along roads that have no median strips, is the removal of valuable road space presently used by motorists, which will have a significant effect on in-town traffic congestion. Cartoon by John Pritchett.
![]() October 13, 2006.
October 13, 2006.
Salt Lake Tribune: HOT lanes are for ordinary commuters:
As an interim measure
before the installation of electronic tolling,
Salt Lake City began selling decals for using
their new HOT lanes. They found that "It's not
luxury vehicle motorists who are buying
permits to drive solo in Interstate 15 carpool
lanes but rather ordinary commuters, whose
e-mails and survey comments are helping the
Utah Department of Transportation refine their
tolling experiment.
A statistical breakdown of
those who paid $50 for High Occupancy Toll
lane permits shows nearly 43 percent drive
Fords, Toyotas, Chevrolets, Hondas and Dodges.
Only two traditionally luxury makes, Lexus and
BMW, cracked the top 10 on the 34-make list of
cars of drivers who bought their way into the
diamond lane."
READ
MORE
![]() October 9, 2006.
October 9, 2006.
Check the events on the top left tab frequently:
Last month was an all-time record for hits on our website. Speaking engagements are being requested, talk radio of all kinds wants us, and Neighborhood Boards are asking us to show up. The issue of rail transit vs. HOT lanes is really heating up. The politicians may think this is a done deal but that is not what the voters are thinking.
Nearly all bus routes will be changed by rail transit:
At the monthly Citizen's Advisory Committee of the Oahu Metropolitan Planning Organization held on September 20th last, Daisy Murai asked about the effects on bus routes. City officials responded that bus routes would be affected by the rail system. The routes would need to be changed in order to create a more efficient total transportation system. Buses that now make long runs would have their routes truncated so that they operate in neighborhoods with shorter, more frequent runs. The entire bus system will be restructured.
This has happened in most cities that have built rail transit. The kind of changes they make often really inconvenience regular riders. For example, if you regularly commute by taking the Route B Express bus from School Street in Kalihi to Downtown, they undoubtedly plan to convert that to local bus service to a rail transit station on Dillingham where you will change to the train that will take you to the station at Fort St. and Nimitz.
![]() October 4, 2006.
October 4, 2006.
The full costs of the rail proposal are staggering:
We have a new article containing a spreadsheet with the $4 billion initial estimate for building rail, upgraded 25 percent to $5 billion to allow for cost overruns, and adding reasonable estimates for bond interest charges and operating losses. When the tax expires we owe $6 billion.
Here's the Summary:
"The University of Aalborg, Denmark, conducted the most extensive international study ever of actual versus estimated costs in transportation infrastructure development. They concluded:
"Based on a sample of 258 transportation infrastructure projects worth US$90 billion and representing different project types, geographical regions, and historical periods, it is found with overwhelming statistical significance that the cost estimates used to decide whether such projects should be built are highly and systematically misleading. Underestimation cannot be explained by error and is best explained by strategic misrepresentation, that is, lying. The policy implications are clear: legislators, administrators, investors, media representatives, and members of the public who value honest numbers should not trust cost estimates and cost-benefit analyses produced by project promoters and their analysts."
Other distinguished and authoritative people have warned about cost misrepresentations. Dr. John Kain, Chair Emeritus of Harvard�s Economics Department, wrote �Deception in Dallas,� Dr. Don Pickrell, Chief Economist of the U.S. Department of Transportation�s Volpe Center, wrote what is known as the Pickrell Report, Dr. Martin Wachs, Chair Emeritus, Department of Urban Planning, UC-Berkeley, wrote �When planners lie with numbers,� and there have been many, many others. We have listed twenty of these studies in the footnotes to this article. We cannot say that no one has warned us about misrepresented costs.
Our spreadsheet contains no provision for capital costs of any kind beyond the initial costs. Nevertheless, it shows that when the additional � percent GE tax expires at the end of 2021, we will have spent $2.6 billion on interest and suffered operating losses of just over $1 billion and yet we will still owe over $6 billion in outstanding City rail bonds. That is because the tax revenues from the � GE tax are far less than the combination of bond interest and operating losses and so we will have had to issue additional bonds to cover this shortfall. The question is, as Mayor Hanneman is fond of saying, �Can we afford it?� and �Can we maintain it?� READ MORE VIEW SPREADSHEET
![]() October 3, 2006.
October 3, 2006.
Shirley Highway HOV lanes give indication:
A recent Virginia DOT release shows that the two Shirley Highway reversible HOV lanes during the morning rush hours carry 14,700 passengers per lane versus 5,325 carried on the adjacent regular freeway lanes. There are 1.15 occupants per vehicle on the freeways vs. 3.72 on the HOV lanes. One must also bear in mind that HOV lanes are less efficient than dynamically priced HOT lanes because pricing allows managers to keep the lanes free-flowing but full. There is no way to fine tune HOVs since you can limit occupants two or three but as Bob Poole says, not 2.7. READ MORE
![]() October 2, 2006.
October 2, 2006.
GAO reviews congestion pricing:
The U.S. General Accounting Office has a new publication out reviewing the history and recent activities in the various states in highway and bridge tolling of various kinds. A most interesting publication. HIGHWAY FINANCE: States� Expanding Use of Tolling Illustrates Diverse Challenges and Strategies. Publication #GAO-06-554. You can order it from GAO HERE or read it online. READ MORE
The "no highways" crowd is losing the battle nationally:
Everything we see lately coming across our desks is a complete change from only a year ago. Then the "no highways they just clog up" crowd were in the ascendancy. We heard that congestion was inevitable and that all we could do was offer people "mobility" � a euphemism for public transportation of some kind, usually rail transit.
Now that has all changed. USDOT Secretary Mineta said in May launching the new initiative,
"Congestion is one of the single largest threats to our economic prosperity and way of life. Whether it takes the form of trucks stalled in traffic, cargo stuck at overwhelmed seaports, or airplanes circling over crowded airports, congestion is costing America an estimated $200 billion a year. Each year, Americans lose 3.7 billion hours and 2.3 billion gallons of fuel sitting in traffic jams and waste $9.4 billion as a result of airline delays. Worse, congestion is affecting the quality of Americans lives by robbing them of time that could be spent with families and friends. Congestion is not a fact of life. It is not a scientific mystery, nor is it an uncontrollable force. Congestion results from poor policy choices and a failure to separate solutions that are effective from those that are not." (emphasis added)
Ken Orski and Robert Poole have both written about the new climate. Orski who only a short while ago said that transportation was at a 'tipping point' is now saying (see below) that we are way passed the tipping point. Today, all the talk is about PPP and congestion pricing of various kinds.
Why we use Census data rather than "boardings":
We were recently asked why we use Census journey-to-work data rather than the "boardings" data typically used by transit agencies and certainly by rail proponents. It's quite simple. The "boardings" data can lead to large increases in apparent ridership when there may have been none. READ MORE
Ken Orski releases text of speech to IBTTA:
Ken Orski of Innovation Briefs, and former Deputy Administrator at FTA, spoke to the International Bridge, Tunnel and Turnpike Association on September 19 on "The Road Ahead." In it he speculates on the incredible changes in transportation policy taking place at both the state and federal levels. READ MORE
Top DOT official opens Denver's HOT lanes:
Federal Highway Administrator J. Richard Capka opened new the high-occupancy toll and express lanes on a seven-mile stretch of I-25 that will give more drivers a choice for congestion free travel between downtown Denver and U.S. 36. READ MORE
We now have a new tab at top left, "Coming Events."
New National Transportation Board meets in Texas:
The first meeting of the new National Surface Transportation Policy and Revenue Study Commission met in Dallas ten days ago. The San Antonio Express-News reports that they met there because Texas has "unplugged from national efforts" and is going its way with emphasis on tolling and public-private partnerships (PPP), which is now the national policy (See May 17 post). READ MORE
Sunday Star-Bulletin features "Lanes, not trains":
Dave Rolf wrote a masterful piece on the advantages of High-Occupancy Toll (HOT) lanes and the disadvantages of rail transit. This is an absolute must read to pass around. It has several photos of the Tampa Expressway. READ MORE
![]() October 1, 2006.
October 1, 2006.
Reason Foundation's Poole has new presentation:
![]() September 30, 2006.
September 30, 2006.
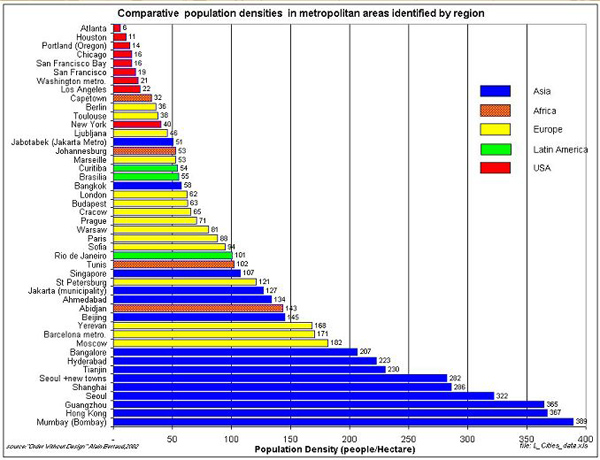
Urban density and rail put in perspective:
Print out the chart below and next time someone says that rail transit works in Hong Kong, Singapore and London, you can take out the chart and show them why; Hong Kong has density ten times that of New York. Put another way, For every hundred people per city block in New York there are one thousand in Hong Kong.
![]() September 29, 2006.
September 29, 2006.
San Francisco traffic signals go digital:
Says the San Francisco Examiner, " The answer to gridlock in San Francisco just may reside in a room filled with computer monitors and projection screens showing live video and virtual simulations of The City�s streets. After years of planning, $9 million and the collaboration of several city agencies, The City unveiled the future of its transportation brain on Tuesday. A new system called SF Go will allow The City to use computers to quickly respond when traffic signals need repairs, to monitor traffic flow in key city hotspots and better plan for large events by making changes to traffic signals and pedestrian crosswalks electronically instead of by hand. Muni Executive Director Nathaniel Ford said the system is the future of the industry and just one phase of what his department hopes to do. READ MORE
Dr. Prevedouros opined for us that, "Honolulu's traffic signals operation is comparable to San Francisco's. They have about 1200 intersections with traffic lights, we have a little over 800. We also have direct communications with the local traffic controllers, most critical intersections have CCTV surveillance cameras, and all intersections have sensors to detect traffic and respond to it. So most of the infrastructure needed to run an efficient operation is there. What we do not have enough of is traffic and electronics engineers specializing in urban traffic control (UTC) operations to make the most out of the infrastructure. Our small and overburdened staff barely make the system work. They can't make it work well. Honolulu needs at least a half dozen experts added to its UTC operation. Once this is done, it should not surprise anyone if travel times on some routes are cut by one third or more.
Tam
 pa traffic now rolling out congestion
free:
pa traffic now rolling out congestion
free:
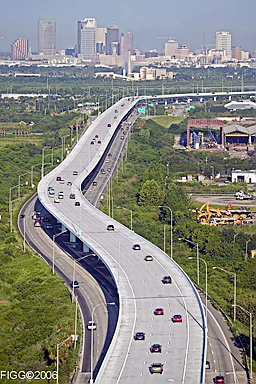
This photo, courtesy of the designers, Figg Engineering, shows an aerial view of traffic going into Town in the morning. At this time Tampa is only charging a simple $1 toll because the expressway has given them excess highway capacity. However, Tampa is one of the nation's fastest growing cities and the idea is that in time they will convert to High Occupancy Toll (HOT) lanes with dynamic pricing.
The elevated expressway is reversible and so from very early morning on all three lanes run one-way into downtown Tampa. At the middle of the day the traffic flow is reversed. In the process, off ramps become on ramps and on ramps become off ramps.
Dynamic pricing is used on San Diego's HOT lanes to fine tune traffic so that they run full but congestion-free at all times. Computers anticipate what tolls will have to be every six minutes and the price is posted one third of a mile before the entrance to the HOT lanes.
The Tampa Expressway opened ahead of schedule in July to offer one way trips into town and the reversible feature was opened at the end of August.
Total cost of the project will depend what the courts award the Tampa-Hillsborough Expressway Authority for the errors made by one of the sub-contractors who made some serious errors in their soil assessments. The remedial construction necessary to fix the errors cost about $100 million and they are confident of recovering this amount. If that is the case, total cost of the 9-mile project will $320 million.
![]() September 25, 2006.
September 25, 2006.
New Surface Transportation Innovations out:
Robert Poole of Reason Foundation has just released the September Issue of his Surface Transportation Innovations. It is must reading for those interested in the latest developments of urban transportation. Bob sends it by email and is free for just signing up.
This issue deals with, among other items:
- Peter Samuel�s new study in the Mobility Project series, Innovative Roadway Design: Making Highways More Likeable. New ways to fit highway capacity in built up urban areas. An absolute must read for anyone with an interest in increasing highway capacity.
- Portland Confronts Goods-Movement Congestion. Poole details how Portland forgot about goods movement in developing its land-use and transportation policies. Now it is paying for it. Congestion has added 20-30 minutes to the daily travel times for its electric company�s trimming and line crews adding costs of $30-$50 per day per crew. Intel has shifted outgoing shipments back two hours to be sure they get to the airport on time and so on. This study foretells what Honolulu is in for since we are following the same path. This is all detailed in a new study from the Economic Development Research Group and available U
- Brookings Institute�s transportation scholar�s new study, On the Social Desirability of Urban Rail Systems in the Journal of Urban Economics. The study weighs the contribution of U.S. urban rail systems to social welfare. Considering everything, the study concludes that only the Bay Area�s BART produces net social benefits. All 23 other rail systems are net losers. For example, Dallas is a net loser of $457 million a year, Sacramento $106 million, and San Jose $210 million annually. (Note: The operators of these three losers will be at the Mayor�s Symposium on October 5 to tell us about the advantages or urban rail (?).
![]() September 24, 2006.
September 24, 2006.
City admits traffic congestion will get worse with rail:
The city is finally making it clear that traffic congestion is going to get far worse than it is today � with or without rail transit.
First, here is the what was said to the Advertiser as reported a week ago Friday:
�The latest projections show that by 2030 a rail transit line could ease traffic congestion by 10 percent overall � as much as the school summer break now helps the morning commute � city transportation officials said yesterday. By then, however, traffic congestion will likely worsen since 30 percent more people are projected to be on the island. And the situation would be even worse without transit improvements, said Toru Hamayasu, chief planner in the city's transportation services department.� READ MORE
Second, the city�s slide presentation last Thursday to the Oahu Metropolitan Planning Organization showed a significant increase in �Daily Islandwide Vehicle Hours of Delay� for 2030 if the rail transit line was built. This, of course, would only occur with significant increases in congestion.
Third, this is what the City says in their website's Frequently Asked Questions:
" Traffic has been increasing rapidly on Oahu. No single project will be able to relieve congestion far into the future. When built, the transit project will help take some drivers off of H-1 and other corridor roadways, whether the managed lanes or fixed-guideway alternative is selected. This will reduce congestion in the short-term, and also help reduce the rate at which congestion grows in the future, but not eliminate traffic congestion in the corridor. All urban areas inevitably experience some level of traffic congestion; however, an effective transit and/or managed lane system provides users mobility despite traffic congestion.� READ MORE
What this spin answer really says is that congestion will get much worse in the future with rail transit in place. The projected growth in population together with the new 60,000 homes already planned will completely overwhelm any minor positive effect of rail transit. This is because neither the city nor the state plan to build any significant new highways as rail transit will use up all the money.
We suggest that you politely ask the city representatives, whenever you have the opportunity, this specific question, �If we build rail, will islandwide traffic congestion in the future be worse than it is today? Yes or no.�
![]() September 20, 2006.
September 20, 2006.
The size of rail stations:
The diagram below is from the 1992 Final Environmental Impact Statement, p. 2-26, and shows the cross-section of a generic rail station. Points to be noted are that:
- Each station must comply with the Americans with Disabilities Act (ADA), which requires that, for example, people in wheel chairs have full access to the rail cars.
- A walk space must be in place underneath the rail line but above the road in order to provide access to the platforms in each direction.
- There are four separate sets of elevators, stairs, and escalators. One on each side of the street from the ground up to the walk space and, in addition, one on each side from the walk space to the train platforms.
- The top of the rail line is 39 feet above the road level and the roof is 57 feet above. Station lengths will be 190 feet with subsequent expansion to 280 feet.
- There will be about 33 of these stations since the line is to be 23 miles long and average station spacing in the 1992 plan was �.7 miles.
![]() September 19, 2006.
September 19, 2006.
The greatest myth is the future growth of transit:
We hear a constant refrain from officialdom that we will grow into rail transit. They say, just build it now and you will see over time that it will pay off as people get used to a transit culture. We are building it for the future, say the true believers.
The problem is that there is no evidence of that happening anywhere in the world even among the heaviest users of public transportation, such as Hong Kong, Manila and Tokyo. They are all losing market share to the automobile. READ MORE The decline in the U.S. is particularly intense (see the slide show above).
With no evidence of rail transit success, at home or abroad, what is driving the true believers into this obviously faith-based frenzy about rail transit. Don't they see that the world has been continually changing from collective transportation to individual transportation? Or is it that the idea of the masses turning away from being collectivized is what bothers them?
If any of our readers have figured this one out, please let us know.
![]() September 16, 2006.
September 16, 2006.
Vancouver is not transportation heaven:
As we have to continually point out, Vancouver's Skytrain is not the panacea that officials are trying to tell us it is. First, Vancouver's buses carry 74 percent of all public transportation trips, with ferries, commuter rail and Skytrain carrying the rest. As is the case in all rail cities, buses are the backbone of transit use.
In addition, Vancouver has not increased the 11 percent of commuters it has carried in the last ten years. This means that for every 100,000 new commuters in the region, 11,000 commute by transit (most by bus) and 74,000 commute by automobile. READ MORE
Since Vancouver, like Honolulu, is not building new highways it is understandable that it has terrible traffic congestion. Their government says, "The number of automobiles is increasing at a rate of 20,000 per year. This population, automobile growth, and goods movement is creating gridlock on Greater Vancouver�s road network, which has had no significant improvements since the 1980s. Greater Vancouver residents consistently rate transportation as the number one issue in the region."
And the British Columbia government says that congestion is costing Vancouver $1.5 billion annually in congestion caused losses. READ MORE
![]() September 15, 2006.
September 15, 2006.
City spins new rail and HOT lanes projections:
Parsons Brinckerhoff (PB) yesterday released to the media its estimates of ridership for the various transit alternatives being considered by the City Council. They are good for a laugh.
Consider this: TheBus ridership peaked in 1984 and has been sliding gently down ever since � despite population growth. However, in 1992, despite this experience, PB forecast bus ridership trips for the �do nothing� alternative for 2005 to increase to 250,000 daily. It turned out to be 170,000, or one-third less than forecast.
In 2003, PB again forecast bus ridership for the �do nothing� for 2006 to be 200,000; it will be 170,000, or 15 percent less than forecast.
Now they are forecasting a 30 percent increase for the �do nothing� alternative despite the fact of continuing declines in bus ridership.
Here�s why: The rail ridership forecast uses for same forecasting model and so they must forecast increases for TheBus otherwise they would show little if any gain for rail. Since they need your support, they have to show significant gains in ridership.
Next laugh: PB is only forecasting a 6 percent greater bus ridership for the HOT lanes alternative even though it would give bus riders a 25 minute shorter rush hour commute from the Leeward area than its takes them currently. In addition, this shorter travel time would give many express buses enough time to return on the regular freeway and make another run. PB believes that this would only lead to a 6 percent increase � even with about a 50 percent increase in commuters from that area?
The best laugh: Today�s report says that �by 2030 a rail transit line could ease traffic congestion by 10 percent overall � By then, however, traffic congestion will likely worsen since 30 percent more people are projected to be on the island.�
And they wonder why we are cynical.
![]() September 13, 2006.
September 13, 2006.
Honey, I shrunk the rail!
Mayor (Can we afford him?) Hanneman has now adopted a "prudent financial philosophy" (Advertiser 9/13) and has limited rail spending to $3 billion. The full extent of the rail line has now shrunk to Kapolei to Downtown. Once more, we find ourselves shaking our heads over the rail transit changes as more and more it reminds us of Alice in Wonderland.
Our more erudite readers will remember that in one of Alice�s adventures she found a bottle with a label that said �DRINK ME.� And she did and she promptly shrank so much that she could then get through � the little door into that lovely garden.�
Perhaps the Mayor found this bottle � and drank from it and it shrunk his train idea.
It is likely that he will get another opportunity to imbibe. That will be when the Council wakes up to the fact that
- The half percent tax increase will not fund a $3 billion rail line, and
- State law makers are not in the mood to allow further GE tax increases for the city.
That means the Council will have to raise city property taxes and/or city gas taxes to fund the construction and � whoops, we forgot, the bond interest, and whoops, the $100 million annual operating losses and whoops, the cost overruns.
At that point, the DRINK ME bottle will again appear and the rail line will shrink some more � say, Chinatown to Downtown?
New cost study for our HOT lanes proposal:
Robert Poole's latest Surface Transportation Innovations newsletter details how Reason Foundation asked the Tampa Expressway Authority and Figg Engineering Corp. to develop some generic costs for elevated tollways of the Tampa design.
The results of that showed Mainland costs would be $18 million per lane-mile for a two-lane version. That means that a 13-mile two-lane tollway, as we have suggested for Honolulu, would cost $468 million, to which must be added $100 million for additional on/off ramps and 36 percent for Hawaii's higher construction costs. Altogether it amounts to $770 million, which is far less than our initial estimate of $1 billion.
The lower costs are because of the technology developed by Figg Engineering, which until the recently opened Tampa Expressway was completed had only been used before in conventional bridge construction.
Other subjects covered in the newsletter are a GAO study on tolling's potential, and details of the new Texas DOT magazine Horizon. READ MORE
Raleigh, NC, is giving up on light rail:
An interesting new study from the John Locke Foundation of Raleigh, North Carolina, details how the 15 year attempt to put light rail into the region has come to naught. Even the state's U.S. Senators have given up on it
The study reviews the various options to reduce traffic congestion in the region and concludes that it does not lie with politicians' "grandiose visions of changing the way people work, shop and live. Rather, "it should be about moving the greatest number of people as fast and as safely as possible at the lowest possible cost . It should be about respecting people's choices, not trying to force them to make different ones."
Their solutions are Bus/Rapid Transit on HOT lanes, congestion pricing, traffic signal optimization and better traffic accident management among others. READ MORE
![]() August 16, 2006.
August 16, 2006.
Here's another chart that needs repeating � often:
|
Percentage using transit |
Increase/(Decrease) |
|||
|
1990 |
2000 |
Drivers |
Drivers |
Transit |
|
New York |
24.8 |
24.9 |
108,237 |
22,710 |
|
Chicago |
13.4 |
11.5 |
321,606 |
(41,250) |
|
Washington DC |
11.0 |
9.4 |
316,912 |
(34,589) |
|
Philadelphia |
10.2 |
8.7 |
138,161 |
(37,403) |
|
San Francisco |
9.3 |
9.5 |
149,957 |
27,849 |
|
Boston |
8.6 |
9.0 |
155,134 |
24,379 |
|
Pittsburgh |
7.4 |
6.2 |
81,306 |
(10,854) |
|
Seattle |
6.1 |
6.8 |
176,336 |
28,528 |
|
Portland |
4.8 |
5.7 |
172,928 |
22,103 |
|
Buffalo |
4.7 |
3.5 |
38,988 |
(14,751) |
|
Los Angeles |
4.6 |
4.7 |
(24,833) |
4,981 |
|
Atlanta |
4.5 |
3.7 |
384,725 |
5,159 |
|
Miami |
4.4 |
3.9 |
147,685 |
(105) |
|
Cleveland |
4.4 |
3.4 |
112,782 |
(9,830) |
|
Denver |
4.0 |
4.3 |
247,718 |
17,241 |
|
San Diego |
3.3 |
3.4 |
87,740 |
3,379 |
|
Salt Lake City |
3.0 |
3.0 |
130,192 |
4,860 |
|
St. Louis |
2.9 |
2.4 |
95,149 |
(4,114) |
|
Sacramento |
2.4 |
2.7 |
86,583 |
5,301 |
|
Dallas |
2.3 |
1.8 |
387,757 |
(873) |
This chart shows the natural result of what happens when we spend a great deal of money building and expanding rail transit.
This table is for the ten-year period from 1990 to 2000, which was the last Census taken. The journey-to-work questions on the Census are the only hard statistics that we have on commuting.
This table, developed by the Federal Highways Administration, was originally for all the largest metropolitan areas. We extracted the 20 metro areas that had rail in 2000 to compare their change from 1990 in commuters using transit versus driving.
You will notice that regardless of what happened with transit usage, virtually every metro area experienced a phenomenal increase in drivers, and, on the average no change in those using transit.
For all the metro areas in the study, the national total showed that out of 13 million new commuters in the ten year period, all commuted by car. The number of commuters using public transportation declined both in actual numbers of people as well as percentages.
Those who favor rail because they think the other guy is going to take the train and free up some road space for them are in for a surprise � it is just not happening. CHECK FACT
![]() August 15, 2006.
August 15, 2006.
Here's a chart that needs repeating � often:
|
Percentage of commuters using transit |
|||
|
|
1980 |
2000 |
|
|
Boston |
9.4 |
9.0 |
� |
|
New York |
26.2 |
24.9 |
� |
|
Chicago |
16.2 |
11.5 |
� |
|
Philadelphia |
12.4 |
8.7 |
� |
|
Cleveland |
7.6 |
3.4 |
� |
|
San Francisco |
11.2 |
9.5 |
� |
|
Washington , DC |
12.5 |
9.4 |
� |
|
Atlanta |
7.0 |
3.7 |
� |
|
San Diego |
3.3 |
3.4 |
� |
|
Seattle |
7.5 |
6.8 |
� |
|
Miami |
4.9 |
3.9 |
� |
|
Pittsburgh |
10.4 |
6.2 |
� |
|
Buffalo |
6.6 |
3.5 |
� |
|
Portland |
7.2 |
5.7 |
� |
|
Sacramento |
3.4 |
2.7 |
� |
|
Los Angeles |
5.1 |
4.7 |
� |
|
St. Louis |
5.6 |
2.4 |
� |
|
Denver |
5.8 |
4.3 |
� |
|
Dallas |
3.4 |
1.8 |
� |
|
Salt Lake City |
4.9 |
3.0 |
� |
This chart shows the failure of U.S. cities to do anything about the nation's increasing traffic congestion. Most of these metro areas have built rail in the 1980-2000 period with a few of them having built them in an earlier time. Regardless, all but one of them have seen their percentage of commuters using public transportation of any kind decline during this time. Only San Diego had an increase and that was from 3.3 to 3.4 percent. In short, from nothing to nothing.
The fact is that we have dramatically changed our life styles in the last 50 years. We no longer shop in our neighborhoods because we can get much better prices at the supermarkets and even better prices in the big box stores, neither one of which is possible using public transportation.
In addition, many of our children no longer live within walking distance from school and so parents drive them there. And on the way back take them to soccer practice. And while the child is playing soccer Mom goes off to her exercise class.
For most adults, trying to do the myriad things that personal transit has made possible in modern times would be difficult if not impossible. For the most part, today's bus riders are those who either cannot physically drive a car, or cannot afford a car, or cannot afford the parking costs. Everyone else wants the freedom, convenience and lower time-costs of a personal vehicle. CHECK FACT
City: If we can't build 1,100 lane miles then we need rail:
The city says in its August glossy brochure that, " If we could afford it, we could build another 1,100 lane miles to serve the residents. This would cost tens of billions of dollars, displace thousands of residents and businesses, and take decades. It would require every road to be widened or have a second level built above it.� And so, ta-da, we need rail. This is the kind of logic that the City and Parsons Brinckerhoff are currently dispensing. The fact is that the ten miles of reversible three-lane HOT lanes we have proposed for the leeward corridor would have a dramatic effect on traffic congestion for those that live there. The City's 1,100 lane miles versus 30 lane-miles is a little different. READ MORE
"Light Rail Is Defeatable" where there's opposition:
Randal O'Toole analyses the cash outlays promoting rail transit versus that of those opposing it. He says that unless proponents outspend the opposition by more than 100 to 1, the opponents win. READ MORE
![]() August 12, 2006.
August 12, 2006.
Randal O'Toole discusses the 'sunk cost' effect:
The
Sunk-Cost
or
Concorde
Effect is the tendency of people to throw good
money after bad. When the British and French
governments were developing the Concorde
supersonic plane, they soon realized that
there was no market for the plane. But they
continued to pour money into the project
anyway because "they had too much invested to
quit."
Economists argue that, in doing benefit-cost
analyses, sunk costs should be ignored because
the question is whether to invest more money.
If the benefits from investing more exceed the
costs yet to be invested, it does not matter
if previous investments were greater. But this
is different from the Sunk-Cost Effect, in
which people argue that, even if future costs
outweigh future benefits, we should still make
the investment because otherwise all previous
investments will go to waste.
READ
MORE
Poole tells us how HOT lanes need to be operated:
In a very interesting article in the July issue of Public Works Financing, Bob Poole, Director of Transportation Studies for Reason Foundation and originator of the HOT lane concept, tells us how we need to structure HOT lane operations. For example, he points out that if you allow HOV-2 vehicles (cars with 2 people in them) free on HOT lanes then you risk creating congestion on them, which destroys both of the ideas behind them. First, creating congestion on HOT lanes when the promise of congestion free commuting is the big attraction, and second, depriving the operation of revenues to pay for them. READ MORE
A Houstonian view of rail and traffic congestion:
Houston, Texas, had the least congestion increase among U.S. major cities during the period studied by the Texas Transportation Institute 1982-2003. CHECK FACT There is a very interesting op/ed in the yesterday's Houston Chronicle that deals with how that has happened. They say:
"� First, Houston has historically fostered a fairly aggressive roadway expansion program.
� Secondly, employers concerned about the adverse effects of lengthy commutes on their work force have moved out of the central business district.
�Lastly, some central business district workers have moved closer to their jobs." READ MORE
![]() August 10, 2006.
August 10, 2006.
Ken Orski's The "Tipping Point" Scenario Revisited :
"Back in March 2006, in a Brief entitled "Highway Tolling Has Reached the Tipping Point," [Ken Orski] wrote: "Virtually every week brings fresh evidence that highway tolling and private financing are gaining new converts among governors and state transportation officials, in state legislatures, and in the media. Growing transportation budget shortfalls, eroding value of highway tax revenues and a supportive federal policy toward tolling and public-private partnerships have helped to nurture the idea. Fanning its spread are visions of highway projects built entirely with private funds and prospects of multi- billion-dollar concessionary cash payments that could jump start ambitious transportation improvements years in advance of their planned execution. Since March, we have issued several updates providing additional evidence that highway tolling and private financing have indeed reached the tipping point. As requested by our readers, we present below a compilation of these news items under one cover, arranged in reverse chronological order and updated through the end of July. " READ MORE
![]() August 4, 2006.
August 4, 2006.
Wendell Cox pens "Half a trillion dollars for nothing":
Wendell Cox, one of the nation's leading urban transportation experts, has written a most interesting op/ed concerning the growth of subsidies for the U.S. public transportation industry. Using federal government data he shows that on a passenger mile basis, transit costs have risen faster than the cost of medical care over the past 35 years. He says that if airline costs were rising at the same rate, off-season discounted fares to Europe from the East coast would be $6,000. This is really worth reading. READ MORE We should note that 35 years ago HRT Company Ltd., ran the bus company and was profitable. Then the city socialized the system and now subsidies are running well in excess of a $100 million annually.
![]() August 2, 2006.
August 2, 2006.
Myth # 9: "New roads will not improve traffic congestion":
� The congestion is not going to be solved by building new roads,� says [Hawaii DOT's Brennon] Morioka. �The more roads you build, the more you encourage people to drive. There needs to be other programs and incentives for people to get out of their cars.� READ MORE
We could not disagree with Brennon more.
This is a myth that government officials and environmentalists keep repeating: Of course they do not bother to think through such a statement. For example, what change induces new traffic to come on to the highway? It is quite simple: The new highway reduced traffic congestion. Duh!
The fact is that if you add highway space to relatively uncongested corridors, it will induce little or no new traffic to come onto it. Conversely, if you add space to a heavily congested corridor, it will induce many new automobiles to join.
But what will induce them to join it is that the new space reduces traffic congestion somewhat despite inducing some new drivers to come onto the expanded highway space.
Here�s what the Texas Transportation Institute, the nation�s authority on traffic congestion, has to say, �The difference between [highway] lane-mile increases and traffic growth compares the change in supply and demand. If roadway capacity has been added at the same rate as travel, the deficit will be zero.� READ MORE
![]() August 1, 2006.
August 1, 2006.
Mayor Hannemann: "Transit solution on track"
The Mayor wrote an op/ed for the Advertiser last Sunday. In it he told us that o nly Los Angeles has an urbanized area with a population density higher than Honolulu. He missed one; he should have included Miami. SEE FHWA DATA
However, the implication is the same: That Honolulu is up there with the big boys and we should have the �vision� they have and build rail transit.
The problem is that these two cities are not performing well. For example, both Miami and Los Angeles built their rail lines during the 1980s and 1990s. Between 1980 (before they built rail lines) and 2000 (the time of the last census) both declined in the percentage of commuters using public transportation of any kind. In short, the gains in the percentage of commuters using rail lines did not offset the loss in bus commuters. Both cities are now down to less than 5 percent of commuters using public transportation.
To be successful in reducing traffic congestion with public transportation you must dramatically increase the percentage of commuters using it. Otherwise, as the population grows the vast majority of new workers will use automobiles to commute, thus worsening traffic congestion. This is precisely what has happened in both of these cities.
Why do elected officials just not understand one simple fact: If you have a highway traffic problem, you can only reduce it with a highway solution?
The High-Occupancy Toll (HOT) lanes project is one remedy. It would be inexpensive relative to rail, the feds will pick up half the cost and toll revenues will pay off the other half. In short, HOT lanes will not require a tax increase of any kind. The only cost that local taxpayers will bear is when they use the toll lanes.